TEM-EDX:Energy Dispersive X-ray Spectroscopy
Features
EDX is a method for measuring the energy and the number of characteristic X-rays generated when an electron beam irradiates the area to be analyzed. The method is used both for elemental and qualitative analysis.
The method is also called EDS, where “S” stands for Spectroscopy. It is often included with both SEM and (S)TEM; this page introduces EDX when included with (S)TEM.
- Simultaneous analysis of the entire element range (B to U)
- Electron probe diameter down to 0.1nm
- Identification and distribution of elements in multi-layer sub-nm films can be obtained from 2D scanning analysis used for drift correction function.
- Extraction and analysis of the energy spectra at any location on the sample
Application Example
Qualitative analysis of regions below 1 μm.
- Analysis of residues from wet or reactive ion etching (RIE)
- Spatial analysis of impurities and wafer defects identified by KLA-Tencor® defect inspection equipment
- Qualitative and morphological analysis of Ni silicide
- Atomic-scale 2D scanning analysis of single crystalline regions
- Segregation analysis of ion implantation layers in devices
Principle
|
The energy of the characteristic X-rays of an element is unique so the sample constituents can be identified by analyzing the X-ray spectrum.
The areas of the characteristic spectral peaks relative to the peak areas of other elements give information about the relative composition.
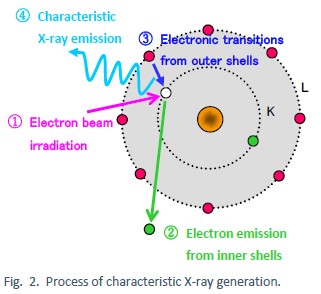
When an atom in its ground state is irradiated with an electron beam (see ① in Fig. 2), the inner shell electrons are removed with a certain probability, creating vacancies in the inner electron shell (see ② in Fig. 2).
However, the state with vacancies in the inner shell is energetically unstable so that the outer shell electrons transition to the inner shell as shown in ③ of Fig. 2. As a result, a characteristic X-rays corresponding to the energy difference of the transition, is emitted (④ in Fig. 2). Since
there could be several different transitions, peaks of different energies can be seen in the spectrum, and this spectrum signature is unique to each element. The relative sizes of the peaks represent the difference in transition probabilities between the particular elements.
|
|
Data examples
Note: The samples in Fig. 4 and Fig. 5 are provided by Professor Akira Yamada of Tokyo Institute of Technology.
Specifications
Note: 2D scanning analysis has a higher detection limit because the sampling time per location is extremely short compared to a single-point analysis.
Items for enquiries
- Purpose and content of measurement
- Observation purposes and regions of interest (ROI) and sample information
- Number of samples, and availability of preliminary samples
- Location of the point/area subject to analysis.
- Element of interest (for 1D or 2D scanning analysis)
- Layer structure/film thickness
- Handling instructions (for details see STEM page)
- Details on delivery
- Preferred due date for preliminary analysis report
- Due date for delivery of final report
- Any other issues
Caution
- Like TEM, thinning of the sample by focused ion beam etching (FIB) or ion milling is necessary. In some cases, however, thinning may prove difficult.
- Sample preparation and observation might alter the sample structure.
- Hydrocarbon and other substances from the sample preparation may adsorb to the system during analysis and, as a result, carbon and other elements may appear in the spectra.
- Elements of interest should be selected by considering the effect of secondary electron scattering in the sample flake, and stray X-ray radiation from, e.g., electron beam irradiation of the specimen substrate and/or the equipment. The stray X-ray radiation may not always be possible to distinguish from X-rays originating from the specimen.
[TEM-EDX]エネルギー分散型X線分光法(TEM)の分析事例はこちらからご覧ください。